Quick Tours
We've developed the quick tours of Cartographica in order to acquaint you with the features and capabilities of Cartographica. With the aid of our narrator, Rick Jones, we guide you through Cartographica's key features and methods of operation. The screencasts are in QuickTime format and are viewable on desktop as well as iPhone/iPod touch devices.
If you wish to follow along with the screencasts, the Screencast Data (about 12MB) that we used to when creating them is available.
- Introduction
- Basic Elements
- Importing and Exporting Data
- Layer Styles
- Geocoding
- Table Tools
- Selecting Features
- Live Maps
- Editing Features
- Merging Data
- Counting Points in Polygons
- Computed Columns
- Kernel Density Mapping
- Convex Hull Creation
- Buffering
- Map Layout
- Overlay Functions
- Editing and Snapping
- Cluster Analysis
- Spatial Join
☆ More tutorials and follow-alongs at the the Cartographica Blog
Introduction
This screencast serves as an introduction to both Cartographica and our suite of screencasts. Serving as the basis for the rest of the Quick Tour series, it provides a basic overview of old and new functionality and is a good starting point for existing users and those who are upgrading.
Basic Elements
This screencast describes the basic elements within Cartographica. It includes demonstrations of basic tools like zoom, measure, and pan. This screencast also shows the relationship between the map and data views. Lastly, this screencast briefly touches on each of the menus in the program, and discusses the basic functionality of each.
Importing and Exporting Data
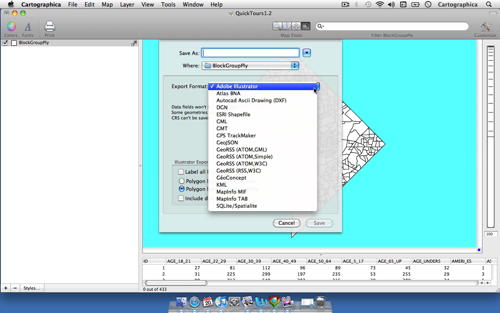
This screencast illustrates importing and exporting data within Cartographica. It includes methods for importing vector, raster, and table data, and it shows where to import GPS, WFS, and Live Maps. Finally, the screencast talks about the different file formats that the program exports to including KML, Adobe Illustrator, and ESRI Shapefiles.
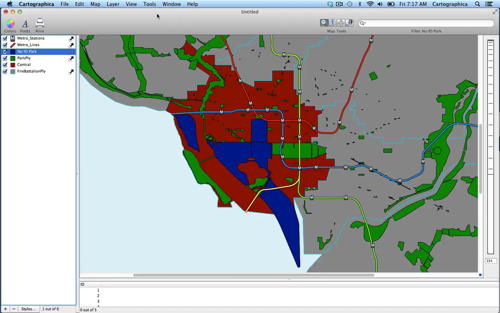
Layer Styles
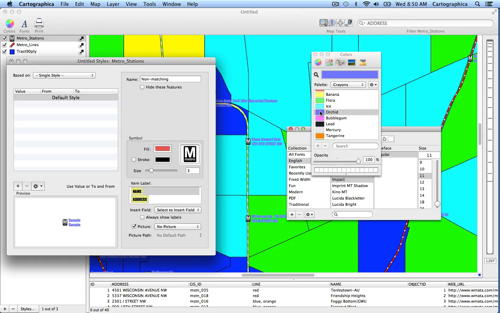
This screencast shows off Cartographica's style system. Version 1.4 has greatly enhanced the ability to edit layer styles and this screencast highlights these changes, while also proving a good introduction. Included are methods for changing point, line, and shape size adding high resolution symbols, adding labels and finally, this is all put into context by showing methods for creating choropleth maps.
Geocoding
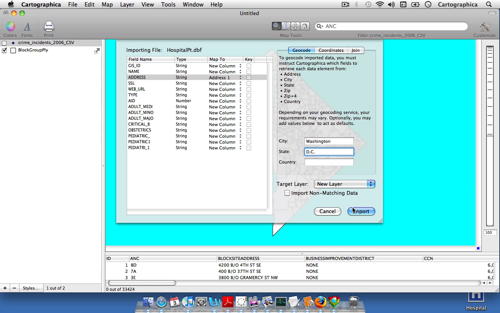
This screencast discusses the methods used for geocoding in Cartographica. The methods include geocoding using coordinates, with MapBox, and by using census street files. The screencast highlights how each method is slightly different and shows the user how to correctly set up the geocoder for each type.
Table Tools
This screencast shows the different tools Cartographica offers to enhance table data. Included are the tools used for each type of vector file. Options for adding centroids, length and area, and midpoints are discussed.
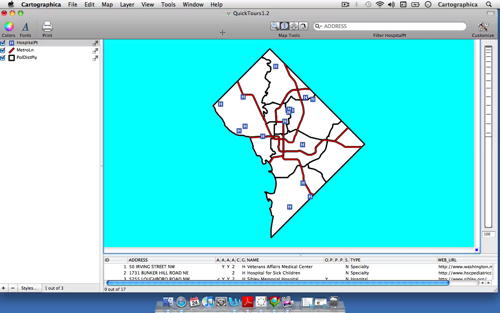
Selecting Features
This screencast shows how to select items using the Filter Bar, the Identify Tool, and using the Data Viewer Window. Finally, we show how to Select Items on Another Layer based on their relationship to items on the selected layer.
Live Maps
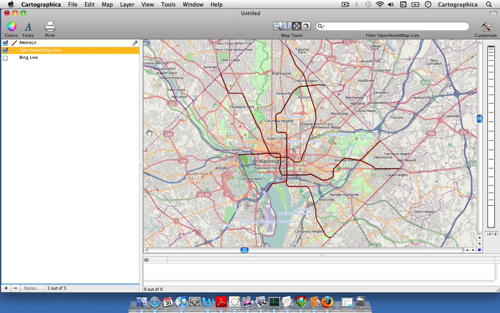
This screencast shows how to Add Live Maps to Cartographica. Live Maps provides access to server-based maps, such as MapBox, and OpenStreetMaps, within Cartographica. Additionally, this screencast shows how other layers can be added on top of the Live Map layers to enhance and develop new analysis capabilities.
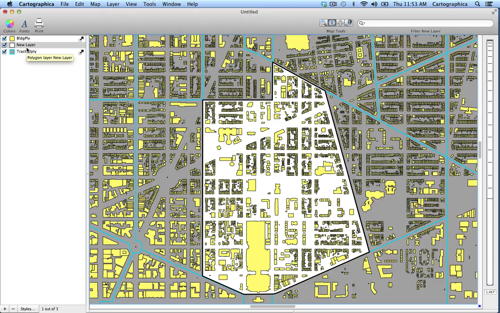
Editing Features
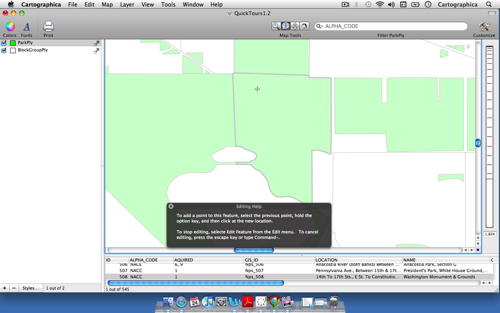
This screencast discusses the methods used for creating and editing features within Cartographica. This example shows how to add new features to already existing features, and how to create a new feature layer from scratch. Additionally, how these tools affect the Data Viewer Window are discussed.
Merging Data
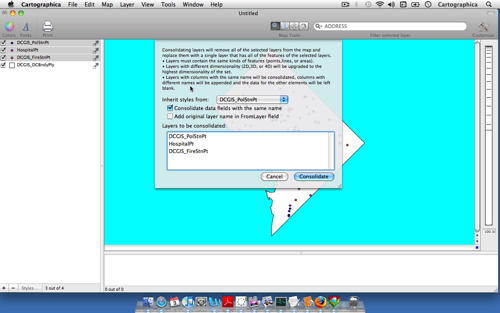
This screencast shows how to merge different layers in Cartographica. In this podcast we detail each of the significant options to the process.
Counting Points in Polygons
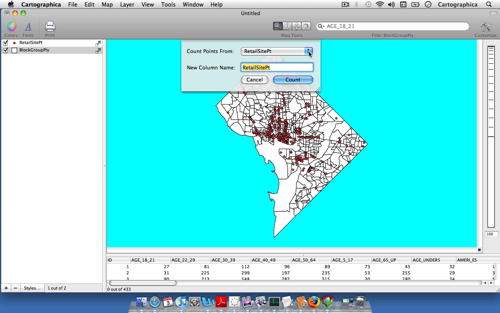
This screencast talks about the methods used in Counting Points in Polygons. Beyond the tool, the screencast mentions how the tool is used in conjunction with chloropleth mapping and discusses how the tool works with the tabular data.
Computed Columns
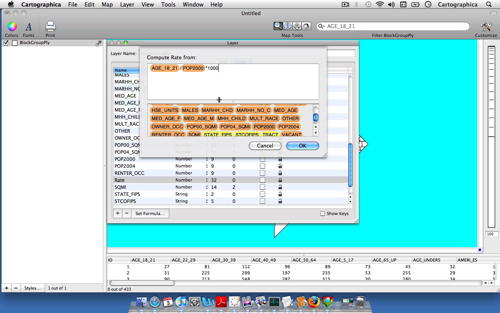
This screencast intoduces this feature new to version 1.2. In our example, we show how to calculate a rate based on data with in a table, and then shows how the rate can be dynamically displayed on a map. This screencast also touches on various elements within the Layer Information Window.
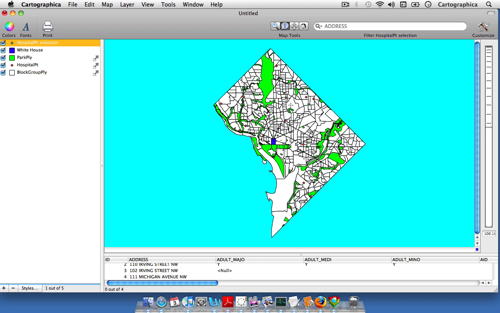
Kernel Density Mapping
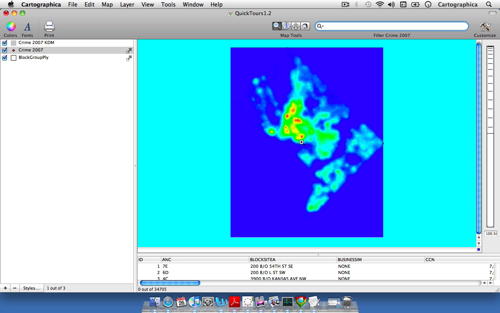
This screencast show the methods used for creating a Kernel density map in Cartographica. The screencast shows how to use the filter bar to select data, and then how to use the Kernel Density tool to determine where concentrations of a layer are located. Also this screencast shows how to use the many different Kernel options that Cartographica offers each of which have a different and interesting effect on how KDMs are created.
Convex Hull Creation
This screencast discusses how to create a Convex Hull in Cartographica. Additionally, we will show how to edit the appearance of convex hulls once they are created.
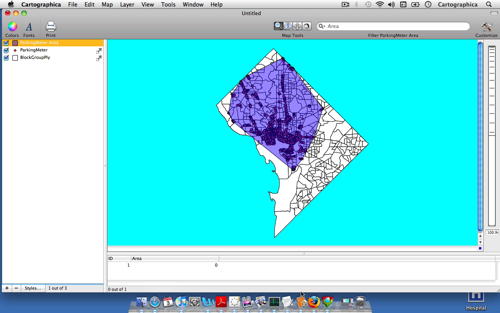
Buffering
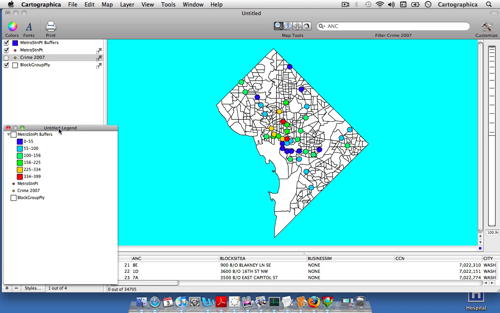
This screencast shows how to create Buffers in Cartographica. In conjunction with creating buffers users will see how to use the Count Points in Polygons tool to greatly enhance the usefulness of buffer analysis. Also you will see how to use Cartographica's powerful layer styles system to dynamically display gradient values created using these tools.
Map Layout
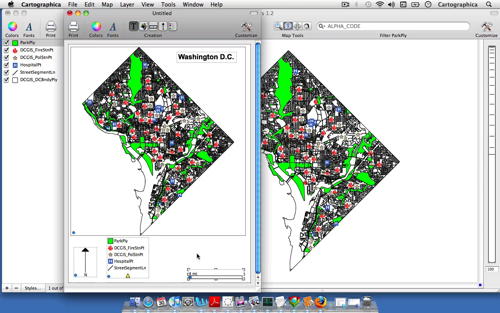
This screencast shows users how to create and edit map layouts for publication. Users will see how to add various elements to map layouts including a compass, North arrow, Legend, and title. Also users will see how to use the Map Layout window's ability to zoom and edit map features as you work.
Overlay Functions
This screencast provides an introduction to the new Overlay functions in Cartographica. Users will see how to use these functions to incorporate data spatially from different layers, trim layers, and clip layers.
Editing and Snapping
This screencast provides an introduction to new snapping functions in the feature editor in Cartographica. Learn how to line up your data quickly and easily with this powerful new feature.
Cluster Analysis
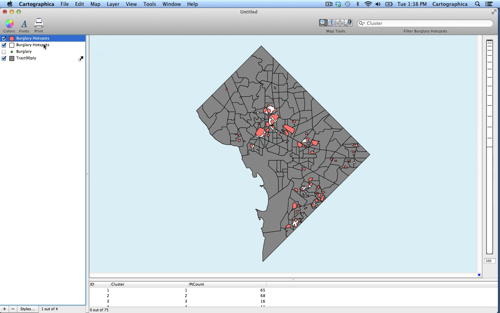
This screencast provides an introduction to the new cluster analysis (or hotspot analysis) functions in Cartographica 1.4. Learn how to pull information out of your point-based incident data, whether it be crimes, animal nesting locations, or complaints about garbage pickup.
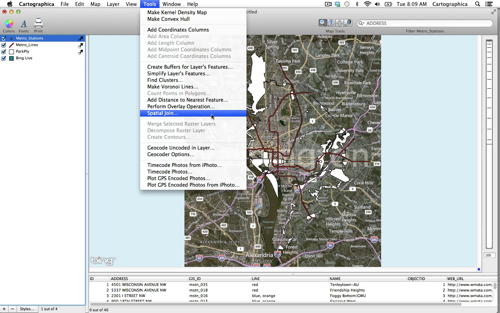
Spatial Join
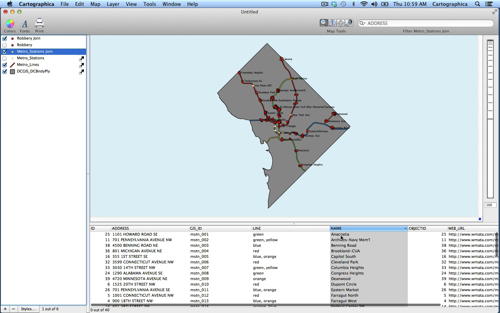
This screencast provides an introduction to the new spatial join features of Cartographica 1.4. Use these to merge data from one layer to another which have some spatial relationship—such as included in/includes/transects/etc. Useful to add area data to points, or use the aggregate functions to aggregate data from multiple points to areas. All geometry types can be used.
Follow-along Guides
More follow-along guides available in the Cartographica Blog